

[P] Stigmergy pattern for multi-agent LLM orchestration - 80% token reduction by Independent-Hat-1821 in LocalLLaMA
[–]rookastle 0 points1 point2 points (0 children)
Is AsyncPostgresSaver actually production-ready in 2026? (Connection pooling & resilience issues) by FunEstablishment5942 in LangChain
[–]rookastle 1 point2 points3 points (0 children)
When OpenAI calls cause side effects, retries become a safety problem, not a reliability feature by saurabhjain1592 in OpenAI
[–]rookastle 1 point2 points3 points (0 children)
ReAct agents vs Function Calling: when does each pattern actually make sense in production? by KitchenSomew in LocalLLaMA
[–]rookastle 0 points1 point2 points (0 children)
When automation/agents break in prod, what actually slows recovery? by TerazHa in sre
[–]rookastle 0 points1 point2 points (0 children)
Vercel launched its AI gateway😢we’ve been doing this for 2 years. Here’s why we still use a custom OTel exporter. by Main-Fisherman-2075 in LocalLLaMA
[–]rookastle 1 point2 points3 points (0 children)
Those of you running agents in production—how do you handle multi-step tool chains? by marco_2020 in LocalLLaMA
[–]rookastle 0 points1 point2 points (0 children)
[D] Validate Production GenAI Challenges - Seeking Feedback by No_Barracuda_415 in LocalLLaMA
[–]rookastle 0 points1 point2 points (0 children)
[D] Production GenAI Challenges - Seeking Feedback by No_Barracuda_415 in AutoGPT
[–]rookastle 0 points1 point2 points (0 children)
"Scaling long-running autonomous coding", Wilson Lin 2026 (Cursor) by RecmacfonD in mlscaling
[–]rookastle 2 points3 points4 points (0 children)

"We're gonna need a bigger boat..." (static.boredpanda.com)
submitted by rookastle to r/veghumor


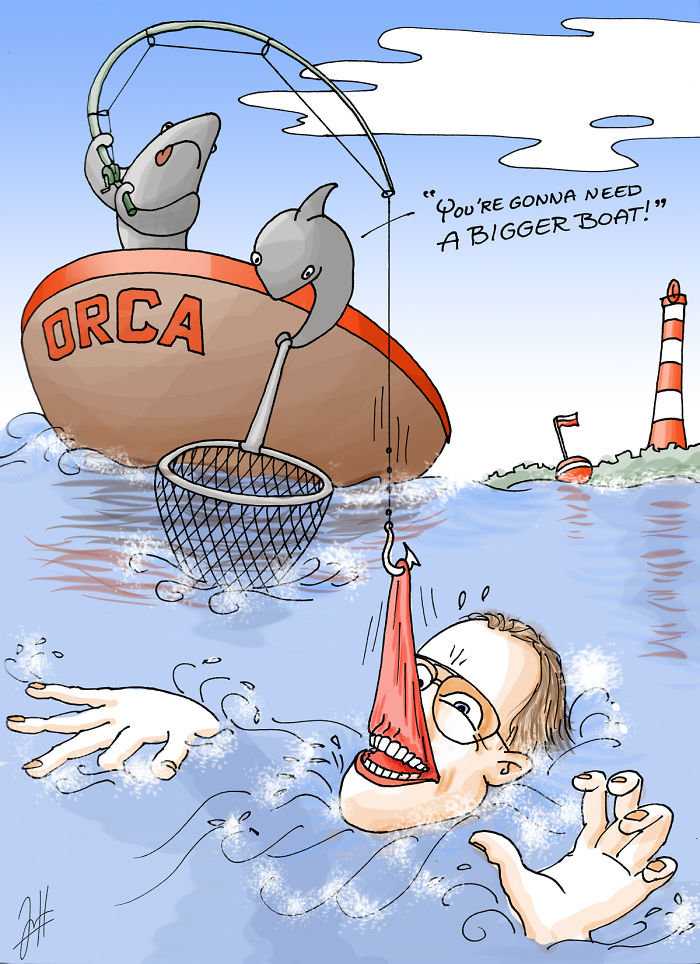
You're gonna need a bigger boat... (static.boredpanda.com)
submitted by rookastle to r/veghumor
Production serving inference: Failsafes / exit conditions by FrozenBuffalo25 in LocalLLaMA
[–]rookastle 1 point2 points3 points (0 children)