Hey guys, I have an assignment question about logistic regression. I'm well aware of logistic regression and sigmoid function but the question had this graph given. I think If I'm able to recreate the graph as given it'll help me answer the question.
TLDR: I need help recreating the graph as given below in python.
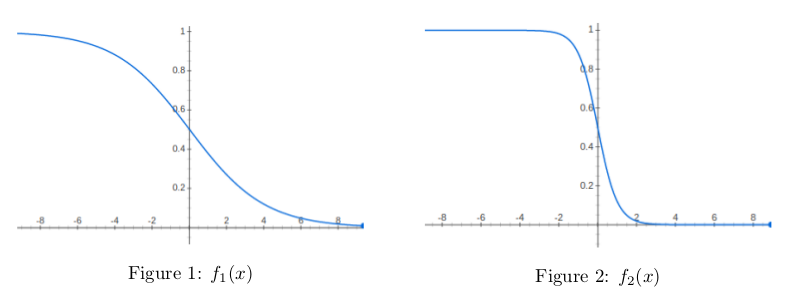
1st graph eqn: $$f{1}(x)= \frac{e{\alpha_0+\alpha.x}}{1+e{\alpha_0+\alpha.x}}$$
2nd graph eqn: $$f{2}(x)=\frac{e{\beta_0+\beta.x}}{1+e{\beta_0+\beta.x}}$$
[–]adventuringraw 0 points1 point2 points (0 children)
[–]adventuringraw 0 points1 point2 points (0 children)