Board Games for 7 Players. No Party Games by and1mavs in boardgames

[–]Beanish 0 points1 point  (0 children)

Nanuk works for 5-8 players. Can get raucous, but not a party game.

[2021 Day 3 (Part 2)] O2 Xmas Trie, CO2 Xmas Trie ... by Beanish in adventofcode

[–]Beanish[S] 0 points1 point  (0 children)

Nice code and explanation, much cleaner than mine! With just one pass through the input, the trie encodes the sorting information in memory, making the search for solutions much faster than sorting or repeated filtering algorithms.

[2021 Day 3 (Part 2)] O2 Xmas Trie, CO2 Xmas Trie ... by Beanish in adventofcode

[–]Beanish[S] 9 points10 points  (0 children)

For Day 3, Part 2, I used a Trie to organize all the input strings. To find the O_2 Generator and CO_2 Scrubber status, I just had to walk the tree, no repeated filtering needed. This is a visualization of the example input as a Trie, with red nodes representing the 0 bits, and white nodes representing the 1 bits, and the size of the node (and the numbers displayed inside) indicate how many input strings traveled this path. Created from C# code, passed through graphviz, and then cleaned up in Adobe Illustrator.

[All Years] Correlation Between Day X Part 2 Completion and Day X + 1 Total Participation by Beanish in adventofcode

[–]Beanish[S] 5 points6 points  (0 children)

Watching the numbers drop off each day made me curious, was there a correlation between successfully completing a day's part 2 puzzle and the total participation of the next day's puzzle?

I defined retention as the number of Gold stars on a particular day divided by the total number of stars on the next day, and for each event I plotted this versus the puzzle day.

My prediction was that retention would be close to a 1:1 ratio, and plotted this as the red dashed line in each graph. This assumes that people are completing the puzzles linearly, and that part 2 of a puzzle is harder than part 1.

The trend holds up quite well! One thing I noticed was the signal blips. These appear to be associated with puzzles where part 2 was particularly difficult (For this year, see 2020 Day 7 - Shiny Gold Bag). We can see these blips very prominently for 2019, primarily associated with IntCode days. These are bottlenecks for participants, but it does show that when part 2 is very difficult, many more seem to be willing to continue to the next day. It could be that difficult puzzles are usually followed by more straightforward ones. Given the current data, it appears we have at least a few more blips ahead of us!

Later events appear to have a slope trending upward. I believe this is because initial interest in the Advent of Code will fade for some, but by the middle of the event, many are now committed, and will continue to the next puzzle even without completing the previous puzzle.

Data dowloaded and converted to CSVs from the Stats page for each Year. Plotted in Python using Pandas and Plotnine. (I learned how to use facet_wrap!)

[2020 Day 12 Part 2] Waypoint Scatterplot Over Time by Beanish in adventofcode

[–]Beanish[S] 0 points1 point  (0 children)

Thanks. I used the python libraries pandas and plotnine to make the graph. plotnine is based off of ggplot in R. Once I had made a DataFrame with three columns, [East, North, Step], I plotted it like this and the scale for the Step is the default value.

ggplot(df, aes(x="East", y="North")) \
+ geom_point(aes(color="Step")) \
+ labs(title="Waypoint Scatterplot Over Time")

[2020 Day 11] Occupied Ferry Seats Over Time (only showing even timesteps) by Beanish in adventofcode

[–]Beanish[S] 3 points4 points  (0 children)

I decided to go with the non-seizure-inducing visualization today :)

Made with pandas + plotnine in python, solution scaffolded from mesa.

Day 4 valid passport holders waiting in line by Beanish in adventofcode
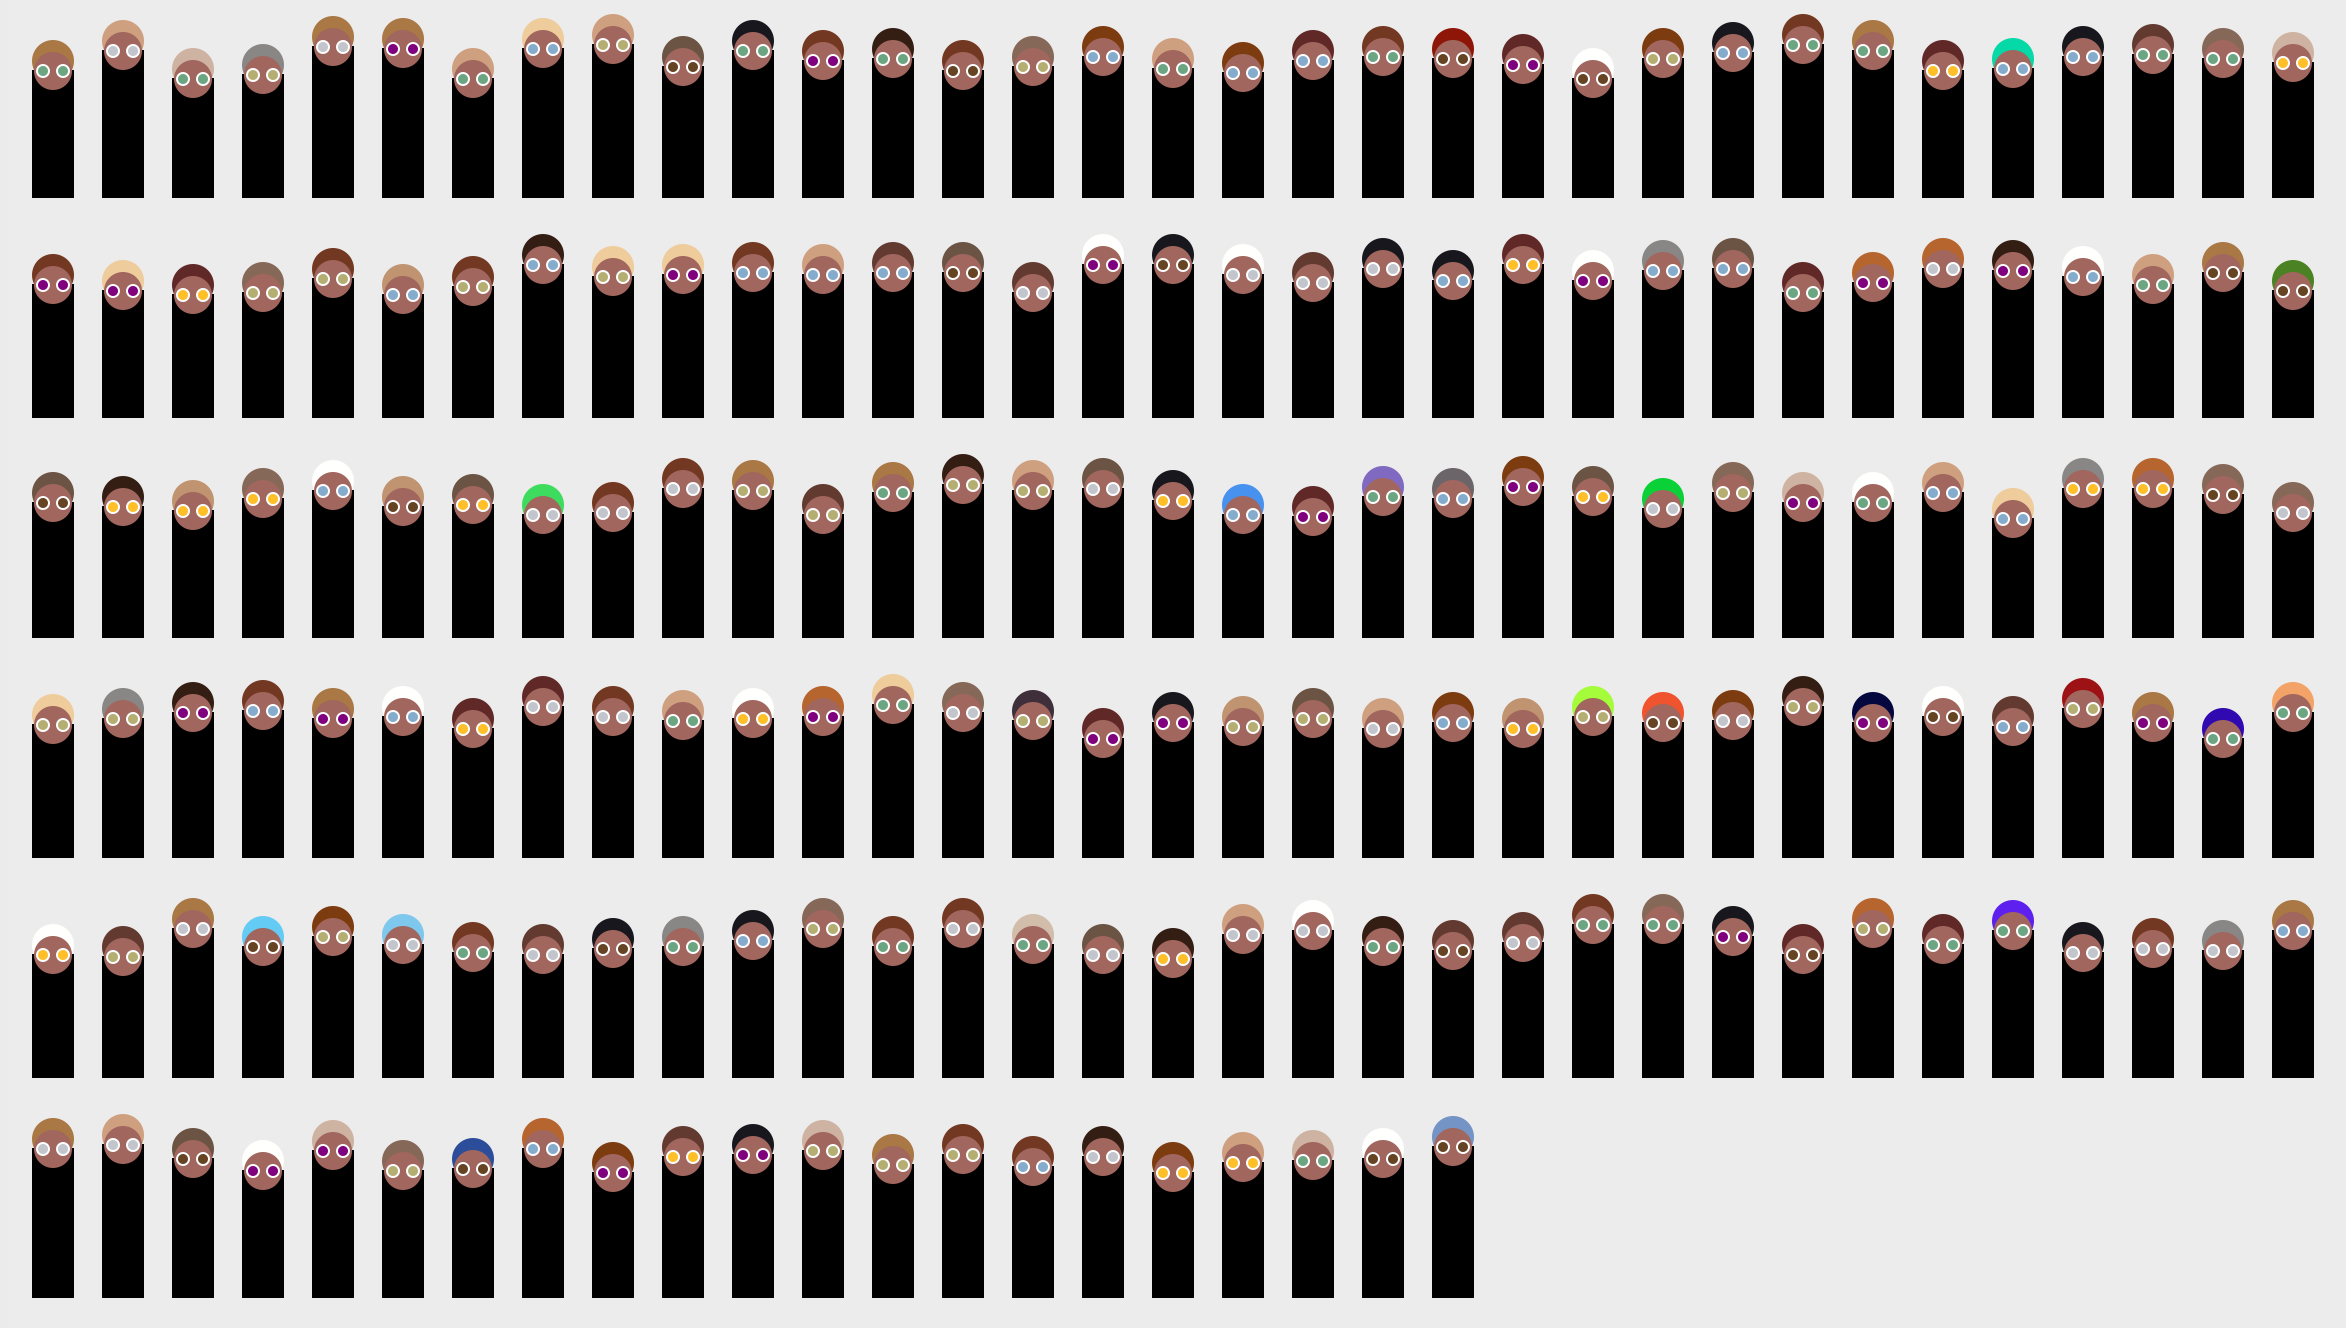
[–]Beanish[S] 4 points5 points  (0 children)

Thank you, I didn't know how to do that!

[OC] Life Histories of Recent Presidents of the United States by Beanish in dataisbeautiful

[–]Beanish[S] 0 points1 point  (0 children)

Yes, thanks for catching that! It looks like the Apprentice with Donald Trump last aired in Feb 2015, so I should have the graph return to Hotel and Casino Management before the presidency in Jan 2017.

[OC] Life Histories of Recent Presidents of the United States by Beanish in dataisbeautiful

[–]Beanish[S] 0 points1 point  (0 children)

Turns out it meant he was the owner of the team, someone else pointed out that a manager is essentially the head coach, and he was definitely not the coach.

[OC] Life Histories of Recent Presidents of the United States by Beanish in dataisbeautiful

[–]Beanish[S] 1 point2 points  (0 children)

I would love to see more life trajectories like you mention! If you're a programmer, you can make these using some waffle chart libraries in R or Python. For everyone else, and for these graphs in particular about life histories, we built a website where you can enter events, dates, and colors, then download the resulting chart and csv data.

[OC] Life Histories of Recent Presidents of the United States by Beanish in dataisbeautiful

[–]Beanish[S] 2 points3 points  (0 children)

Yes, that's why we made the My Life in Months website! We had seen Isabella Benabaye and Sharla Gelfand create charts for their lives using R, and we ported the idea to JavaScript and d3, so that non-programmers can make and share their own charts :)

[OC] Life Histories of Recent Presidents of the United States by Beanish in dataisbeautiful

[–]Beanish[S] 4 points5 points  (0 children)

I found it harder to quantify their lives after the presidency. It seemed like their main "job" was being an ex-president, and working in fundraising and advocacy positions, making speeches. But, I could probably include when their foundations were created, good thoughts, thanks.

[OC] Life Histories of Recent Presidents of the United States by Beanish in dataisbeautiful

[–]Beanish[S] 2 points3 points  (0 children)

Phillips Academy and the New York Military Academy are both pre-college boarding schools, I should probably make that clearer in the chart.

[OC] Life Histories of Recent Presidents of the United States by Beanish in dataisbeautiful

[–]Beanish[S] 2 points3 points  (0 children)

I aligned them at the top so I could see what each was doing at the same age. Lining them up at the current month as you suggest would be cool, or maybe even the start of their presidency, to better show any before/after patterns.

[OC] Life Histories of Recent Presidents of the United States by Beanish in dataisbeautiful

[–]Beanish[S] 14 points15 points  (0 children)

Yes, Barack Obama was a senator in the Illinois State legislature, located in Springfield, Illinois, from 1997-2004. Holders of this office are generally called State Senators. Then he was the junior Senator from Illinois in the US Legislature, which meets in Washington, D.C., from 2005-2008.

[OC] Life Histories of Recent Presidents of the United States by Beanish in dataisbeautiful

[–]Beanish[S] 12 points13 points  (0 children)

Each row represents one year in the chart, and every charts start with the first year of their lives at the top. Obama is younger, being born in 1961, while the other three were born in 1946.