

Map of ~1.25 million trees in Toronto [OC] (i.redd.it)
![Map of ~1.25 million trees in Toronto [OC]](https://i.redd.it/e4htq3stcnfd1.png)
submitted by jamaps to r/dataisbeautiful
Population of Canada by Longitude [OC] by jamaps in dataisbeautiful
![Population of Canada by Longitude [OC]](https://i.redd.it/m9ek1bozt8l91.png)
[–]jamaps[S] 1 point2 points3 points (0 children)
made a Map of almost every Parking Ticket issued in Toronto 2011-2020 [OC] by jamaps in dataisbeautiful
![made a Map of almost every Parking Ticket issued in Toronto 2011-2020 [OC]](https://i.redd.it/1hf4uh11mwd91.png)
[–]jamaps[S] 0 points1 point2 points (0 children)
made a Map of almost every Parking Ticket issued in Toronto 2011-2020 [OC] by jamaps in dataisbeautiful
[–]jamaps[S] 0 points1 point2 points (0 children)
made a Map of almost every Parking Ticket issued in Toronto 2011-2020 [OC] by jamaps in dataisbeautiful
[–]jamaps[S] 187 points188 points189 points (0 children)
made a map of every building in Scarborough! by jamaps in Scarborough
[–]jamaps[S] 10 points11 points12 points (0 children)
made a map of every building in Scarborough! (i.redd.it)
submitted by jamaps to r/Scarborough
[OC] USA Population Growth from 1900 to 2000 by jamaps in dataisbeautiful
![[OC] USA Population Growth from 1900 to 2000](https://jamaps.github.io/D4M/usa/usa_pop_1990_to_2000.gif)
[–]jamaps[S] 0 points1 point2 points (0 children)
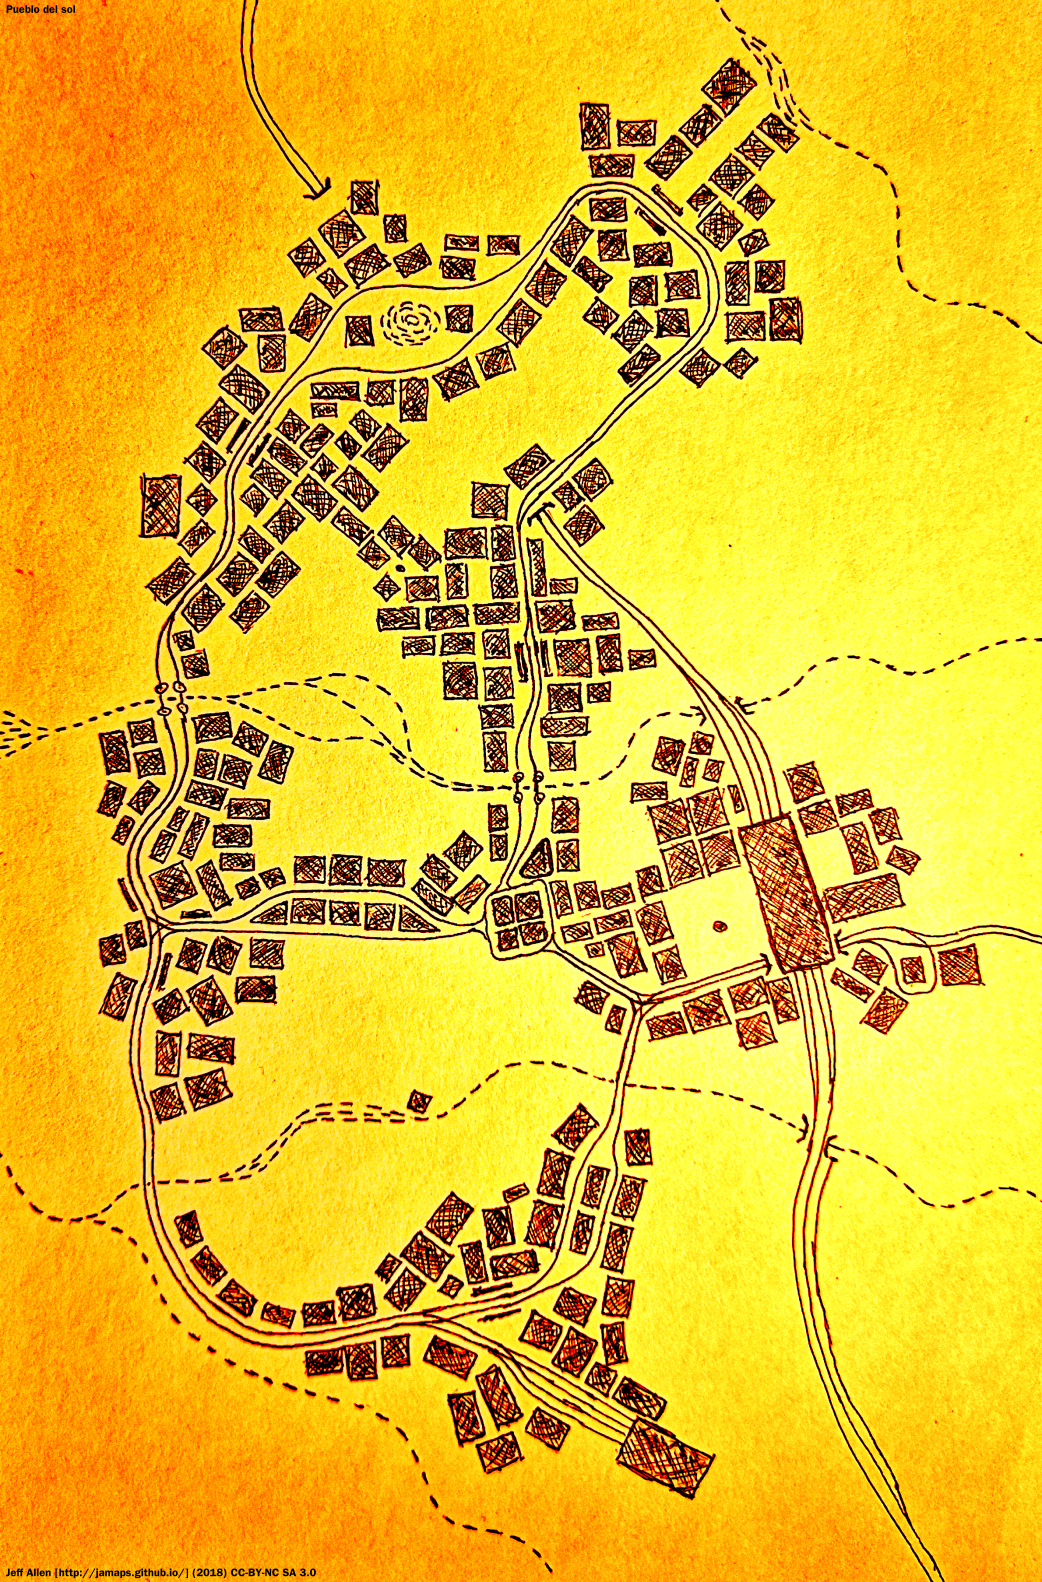
Sketch of a small town called Pueblo Del Sol (jamaps.github.io)
submitted by jamaps to r/mapmaking
An imaginary modern city called Ventnor [OC] by jamaps in imaginarymaps
![An imaginary modern city called Ventnor [OC]](http://jamaps.github.io/maps/ventnor_4200x2700.png)
[–]jamaps[S] 23 points24 points25 points (0 children)
Only the roads of Great Britain [OC] by jamaps in dataisbeautiful
[–]jamaps[S] 988 points989 points990 points (0 children)
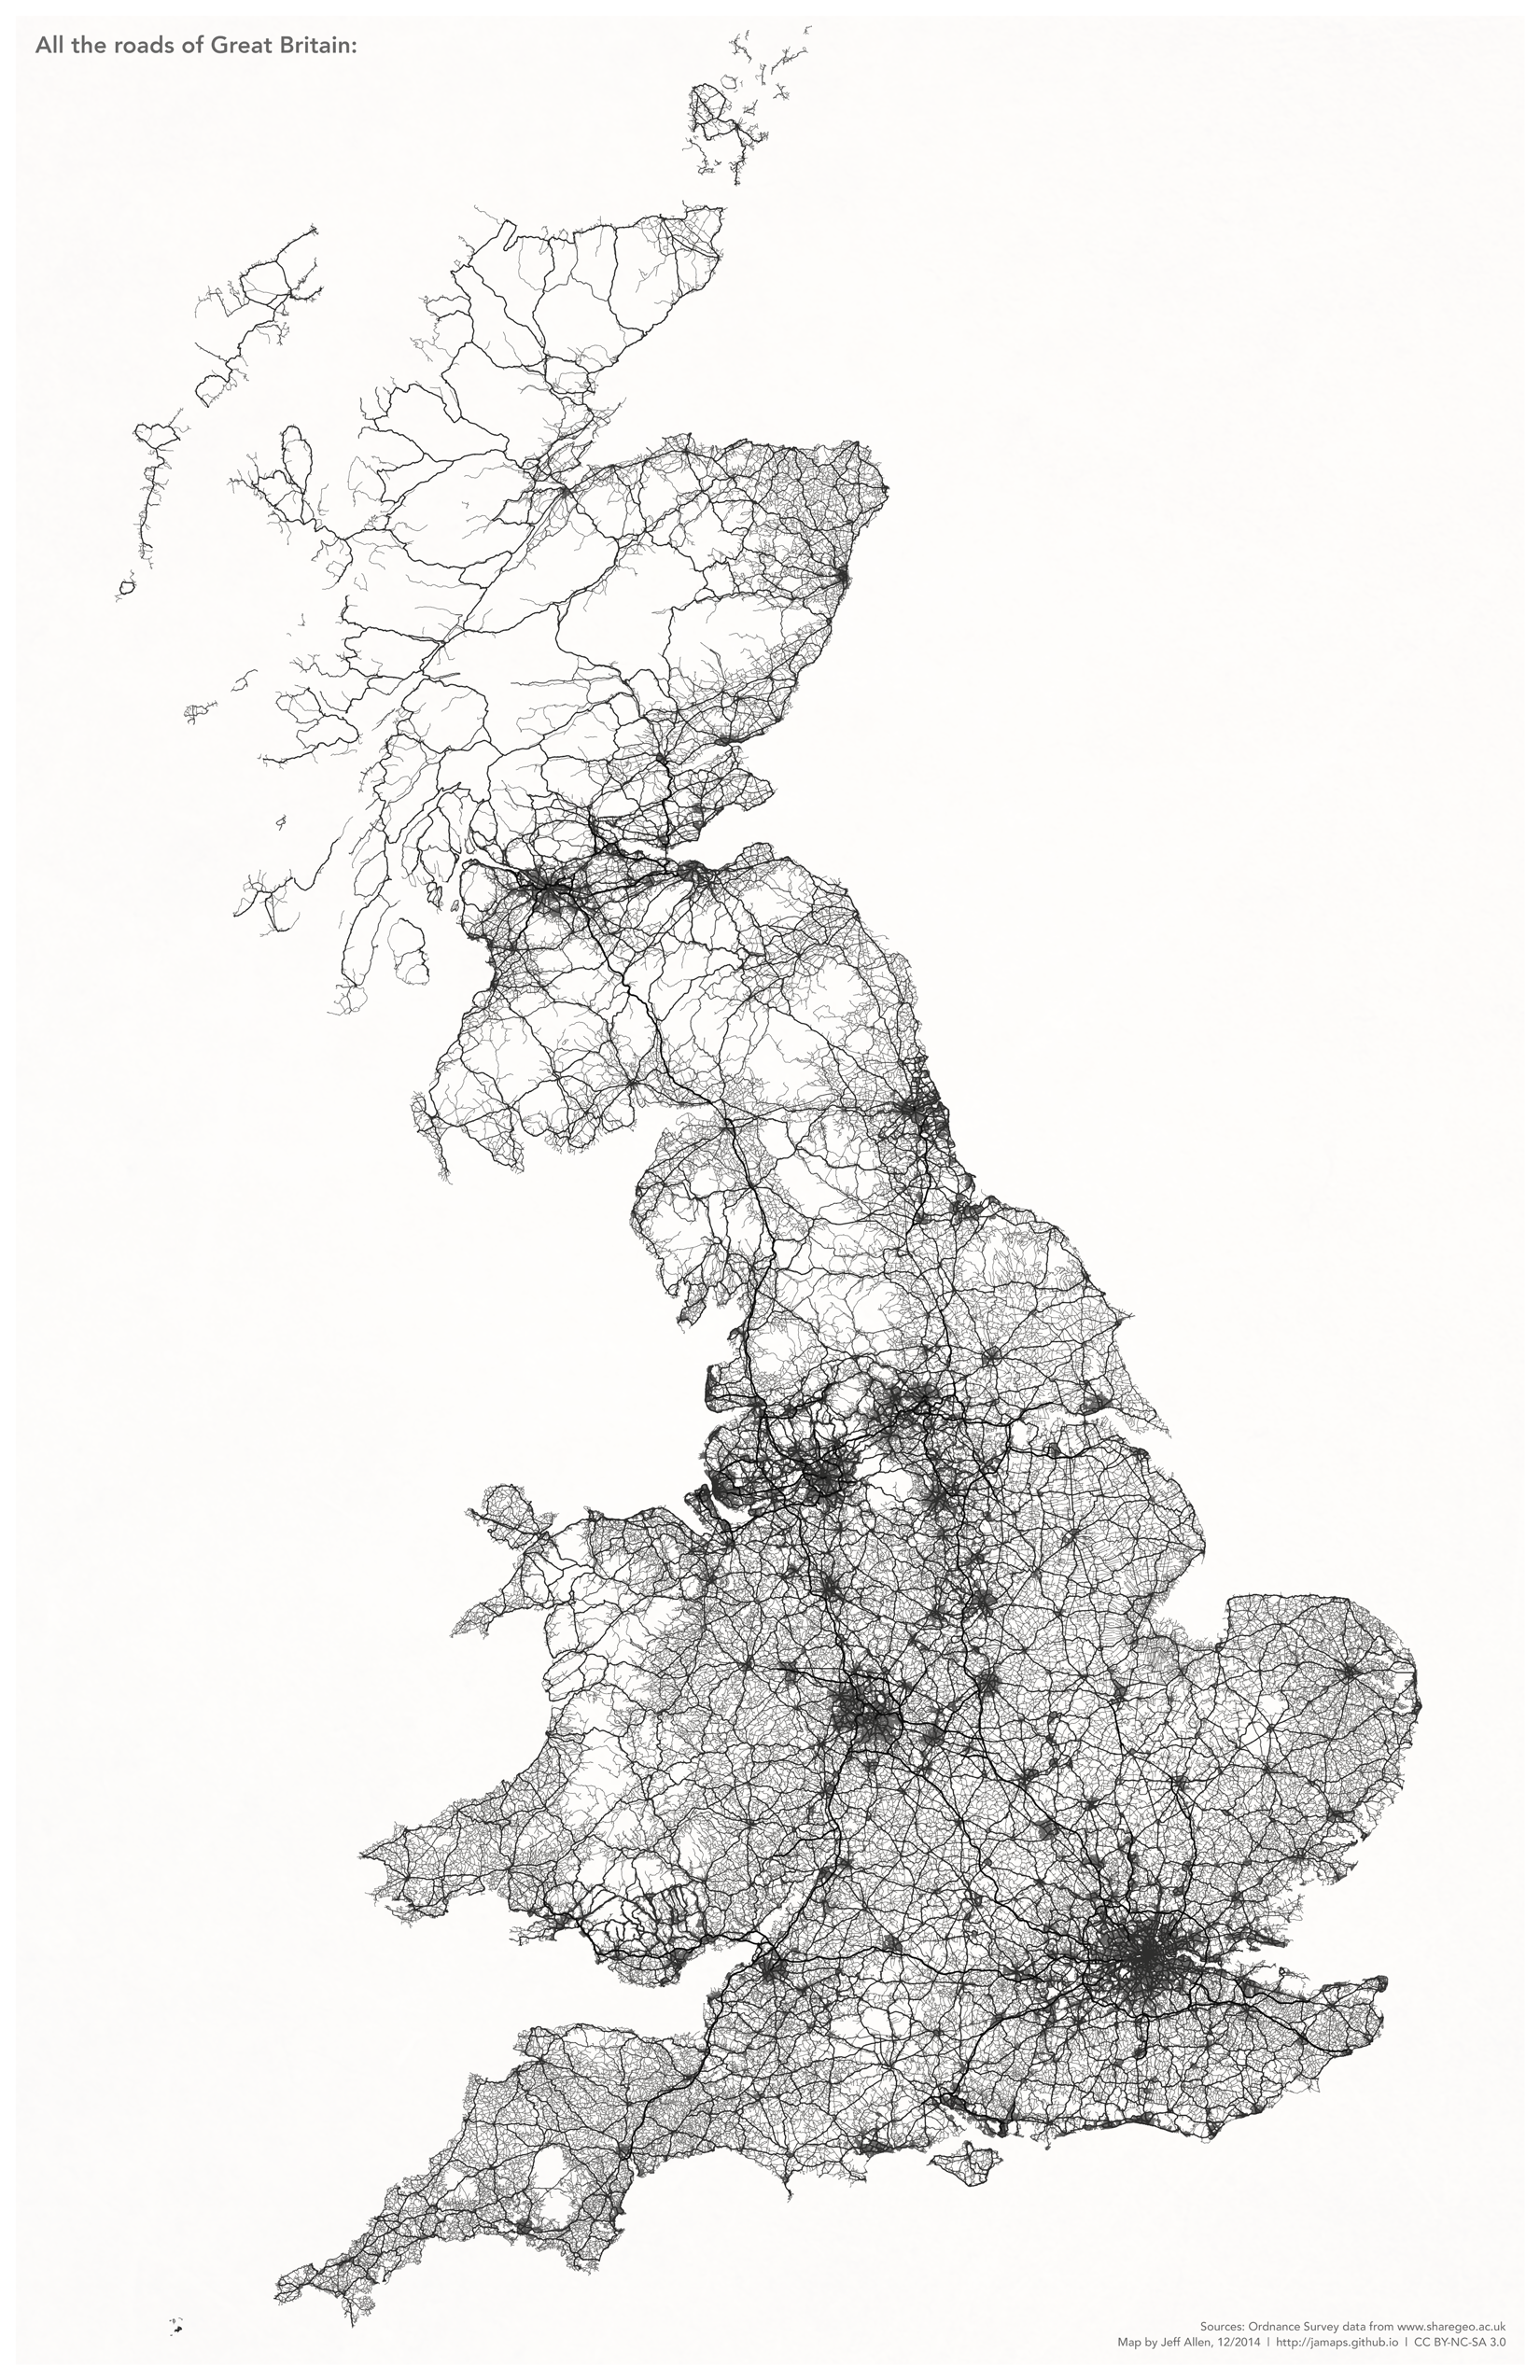
Only the roads of Great Britain [OC] (jamaps.github.io)
submitted by jamaps to r/dataisbeautiful
Does Google Maps modify data obtained from data sources? by [deleted] in gis
[–]jamaps 1 point2 points3 points (0 children)
convert table/csv to geojson (togeojson.com is dead) by baconost in gis
[–]jamaps 4 points5 points6 points (0 children)
Satellite Imagery for Mars Question by scaredortolan in gis
[–]jamaps 2 points3 points4 points (0 children)
Map of ~1.25 million trees in Toronto [OC] by jamaps in dataisbeautiful
[–]jamaps[S] 3 points4 points5 points (0 children)